


.jpg "Get Timeform ratings for every upcoming runner and past result, plus premium winner-finders including commentary, Flags, Pace Maps and lots more.")


 Url copied to clipboard.

Previous modules in The Timeform Knowledge have dealt with form ratings: that is, assessments based on the result (weights carried, margins between horses etc) of the participants at the finish of a race.
But there is another important component of a race result that has not been mentioned so far, and that is time. It is no coincidence that the organisation which brings you this “Knowledge” is named Timeform, for both time and form matter when assessing results.
A race goes to the horse that runs from A to B fastest. However, crucially, the purpose of a horse race is not to run as fast as possible but to run faster than one’s rivals.
The two – running as fast as possible and running faster than one’s rivals – sometimes coincide, but there are a multitude of reasons why they might not. Horse racing is highly tactical, and the optimum strategy in any given circumstance may be to run rather slower than possible and to play to one’s strengths (such as in terms of position and ability to quicken) compared to the strengths of others.
Timeform reckon (and sectional times help to confirm this) that something like 40% of Flat races at the minimum distance of five furlongs are truly-run, but only about half that percentage are truly-run at two miles and further.
As such, a horse’s overall time may be deceptive in terms of identifying its absolute ability.
All is not lost, however: far from it. If you can identify those races in which overall times reflect the contestants’ abilities, you become privy to highly valuable information.
It can be difficult to gauge just how good a race or a performance was in isolation, even with the help of the handicapping processes referred to previously. Measuring such things against an unchanging benchmark – time itself – has clear benefits, though putting this information into its proper context is the tricky bit.
Only good horses can run good times, but both good and bad horses can run bad times. Usain Bolt is capable of running sub-10-seconds for 100 metres, but he could, if he wished, jog the distance in 20 seconds. By running it in 10 seconds, he shows he is a good athlete. If you fancy showing the same, you can try to do likewise!
Timeform’s founder, Phil Bull, put it neatly when referring to racehorses. “A time tells you not how good a horse is but how bad it isn’t” (he probably then took a big drag on his cigar and added “…brother”).
The following explanation of analysis of overall times necessarily involves some simplification.
In order to compare times between different horses, at different distances, and even at different courses and in different eras, you need to come up with benchmarks of time performance.
These “standard times” indicate what horses of the same ability, carrying the same weight compared to their maturity, should be capable of achieving under different circumstances on a standardised surface. An adjustment for the apparent state of that surface can be inferred from the differences between those standard times and the times actually recorded on a card.
It is not the intention to go into detail here about how to compile standard times – that might fill a modestly-sized booklet – other than to say that past races at a given course and distance need to be adjusted for the context in which they were recorded and then analysed statistically. Times are not normally distributed (one consequence of its being easier to run slowly than quickly) so records and averages are unsuitable as benchmarks.
Once having established standard times, however, the difference between a time recorded and this standard time tells you something.
The first step is to adjust this time differential to a fixed measure of time (Timeform uses 60 seconds), then to convert that difference into pounds (Timeform uses 25 lb per second at 60 seconds, giving the constant 1500).
This is achieved by the following formula:
1500*(race time - standard time)/race time
With “*” and “/” standing for “multiply by” and “divide by” according to Excel conventions, while the calculation inside the brackets needs to be completed before being introduced back into the formula.
This can be seen in action by comparing the three races at a mile and a half at Epsom on Derby Day 2015.
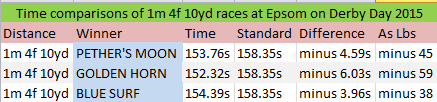
Golden Horn ran fastest, with the result that his time is the largest amount below standard time in terms of pounds, while Blue Surf ran slowest.
However, it is not enough to know just this. What you need to know is how fast those times are compared to a time that could be expected of a horse in the circumstances. That is, you need to allow for the apparent abilities of the horses in question and the weights they were carrying (Timeform compares this to a weight-for-age scale to offset immaturity).
Contrary to what you might read in some places, ability is better established by proper form handicapping (including through standardisation, as described previously) than through rigid “class pars”, and weight should not be ignored.
If our system of ratings is calibrated correctly, you should “expect” a 100-rated horse carrying 9st 0lb to run 10 lb faster in time terms than a 100-rated horse carrying 9st 10lb. And you should expect a 110-rated horse to run 10 lb faster in time terms than a 100-rated horse when both are carrying the same weight. The difference between expectation and reality will tell you something.
The adjustment process involves adding the difference between the weight carried and a fixed measure of weight (Timeform uses 10st 0lb/140 pounds, or its weight-for-age equivalent, on the Flat) plus the horse’s apparent ability (the performance rating to which it ran) to the above “time differential as pounds”, as follows:
The resulting figures indicate how fast those raw times were compared to the abilities and weights carried of the horses concerned, with the lower the figure the better.
It is worth taking a while to familiarise yourself fully with those steps – actual time, compared to standardised time, converted into pounds above or below that standardised time, then normalised for weight carried (compared to weight for age in the examples given) and ability.
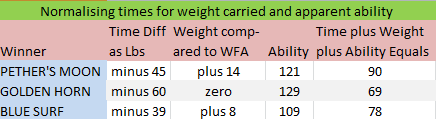
The table above shows comparisons between the three races run at a mile and a half on Derby Day 2015. By adjusting those times for weight carried and ability, we get figures which show how quickly the winners ran compared to expectation, with the lower the figure the better.
Thanks to standard times – which indicate what horses of the same ability, carrying the same weight compared to their maturity, should be capable of achieving under different circumstances on a standardised surface – this can be extended to all races on the card, regardless of the distance over which they were run.
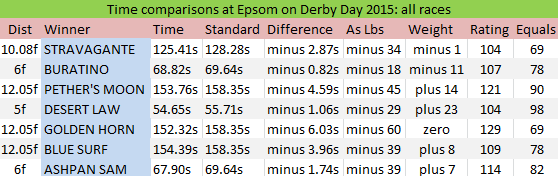
We know from our research that between 20% and 40% of Flat races are truly-run, depending on distance. It follows that it is highly likely (around 92% likelihood in this instance) that at least one of the races on a seven-race card will have been truly-run, with the winner’s time being reflective of, or nearly reflective of, its true ability. That seems a reasonable basis on which to proceed.
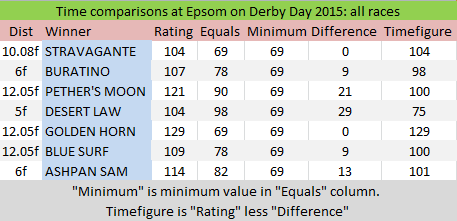
If we regard the lowest value in the “equals” column as indicating a truly-run race in which the overall time reflected the true ability of the winner, it is a relatively simple process to establish time-based ratings for each of the winners by subtracting from those winners’ ratings the difference between the “equals” figures and that minimum value, thus:
On a basic level, that may be all you need to do. But that should really just be a starting point for closer inspection.
It could be that it is worth taking an even higher view of the form of the winners with the fastest times relative to their perceived abilities, for a fast time may indicate that you have sold that ability short. And if you take a higher view of the fastest, the remainder will rise in line with that. For instance, however, good Golden Horn’s timefigure is, or isn’t, it will remain 29 lb faster than Pether’s Moon’s and Blue Surf’s.
Furthermore, while standard times allow for precise comparisons between races run at different distances, and even on different courses, that applies generally: in given circumstances, other factors may be at play.
The surprisingly “slow” five-furlong race won by Desert Law was the only one on the straight course that day and was dealt with separately. Wind made a small but discernible difference to the times relative to each other, with the result that Golden Horn’s stellar 129 timefigure was edged down to a still extremely good 127, while Buratino went up to 103 (Timeform uses vector analysis to adjust for wind, based on input from its on-the-spot reporters and meteorological organisations).
Rail movements – details of which appear on the BHA’s website – can add to, or occasionally subtract from, advertised distances (though this was not the case here). Round courses and straight courses can have apparently different going and need to be dealt with on a pro-rata basis, according to how much of a race took place on one or the other.
It does not take long to become proficient in such matters, with a little practice.
Incidentally, that minimum value (69 in the table) represents something else important: it is the rating a horse would need to run to, in a truly-run race, carrying 10st 0lb or the weight-for-age equivalent, in order to equal standard time.
As such, it represents a going allowance, with lower indicating firmer, though one that may be tweaked after that “closer inspection” of the figures mentioned earlier.
Those are the time-based figures for the winners, of course. How do you get the same for the horses those winners beat?
Well, official margins between horses have been conversions of time lapses in Britain since 1997, so it follows that you can deduce beaten horses’ individual times from the available information (give or take some rounding) and calculate accordingly.
The official conversions used are laid out on page 39 of the free-to-download “Sectional Timing: An Introduction by Timeform”, though quite why British racing cannot provide the individual times themselves as a part of the results is a mystery.
Remember that differences in weight and maturity need to be allowed for, where they exist, but Golden Horn’s Derby gives an example of how this works with horses of the same age and carrying the same weight.
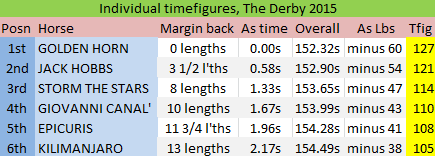
The same calculations as for winners are performed on beaten horses, whose individual times have been engineered from the time of the winner and the official margins back.
If Storm The Stars was eight lengths back from the winner at the finish, that means he was 8/6 seconds back, or 1.33s (6 lengths per second was the official conversion in use). As we know the winner recorded 152.32s, that makes Storm The Stars’ time 153.65s. If we then calculate 1500*(race time – standard time)/race time, we get minus 47, or 13 lb slower than the winner. Q.E.D.
Analysis of overall times can be very useful and almost useless, depending on circumstance, but analysis of a whole card will always tell you something meaningful.
The reason why some results are “almost useless” has been touched upon already. A slow time may mean nothing more than that the race was run in a manner which produced slow times. That – the effect of pace on times – is the province of sectional timing, which will be the subject of the next in this series of The Timeform Knowledge.
.jpg&w=300)
.jpg&w=300)
.jpg&w=300)
.jpg&w=300)
.jpg&w=300)


