


.jpg)
.jpg "Get Timeform ratings for every upcoming runner and past result, plus premium winner-finders including commentary, Flags, Pace Maps and lots more.")


 Url copied to clipboard.

Some of the misconceptions about sectional-timing analysis have faded away in recent times, but a few others persist.
You hear or read much less these days about how “sectionals are irrelevant in British Racing due to the varying nature of the tracks” or even that “the tactical nature of racing in this country renders sectionals of little worth”.
Both factors make sophisticated sectionals more, rather than less, useful, while the latter is precisely why sectionals are desirable: if races were not tactical, final times would tell you pretty much all you needed to know about a horse’s merit on a given day.
But races are tactical, often crucially so, and that is an aspect of the sport which sectional timing helps to identify, highlight and quantify.
Far from being a dull exercise in number-crunching, an understanding of sectional analysis is a gateway to a world of nuanced interplay between pace and position, of horses’ and jockeys’ strengths and weaknesses, and occasionally of insight into remarkable performances which go under-appreciated by the wider public.
One of the more enduring misconceptions is that all of this may, after all, apply to Flat racing, but not to jumps. Think again.
Flat racing and jump racing do not occupy separate universes, governed by different physical laws (though their followers sometimes seem to!). The same principles apply, and can sometimes be seen in starker relief in “the winter game” than in the summer one.
If a horse expends its energy inefficiently, its overall time will be negatively impacted, whether it is a sprint or a staying chase. If stamina is that horse’s strong suit, it will be ill-served by a crawl and then a sprint, whether that takes place at mile or at three miles plus.
Whether on the Flat or over jumps, slowly-run races tend to compress margins while races run at overly-strong paces will tend to exaggerate them, in both cases increasing the possibility of misleading results and erroneous assessments.
In each instance, the only failsafe way of establishing the facts is through figures, sectional figures, which may then be compared with what might be expected in the circumstances, after which a better understanding of the race, and of the horses within that race, should be possible.
That there may be a big difference in the dynamics of jumps races in different circumstances can be illustrated by reference to Cheltenham Gold Cups, both recent and distant.
Each of the races was retimed using video-editing software, the BHA’s re-measurement in 2015 showing that the Cheltenham Gold Cup had, in fact, always been 3m 2f 70y in length (not 40 yards longer or 70 yards shorter as previously imagined) and that the third-last was 845 yards from the finish.
Other Cheltenham Gold Cup sectional figures may be found on page 36 of the free-to-download Sectional Timing: An Introduction by Timeform.
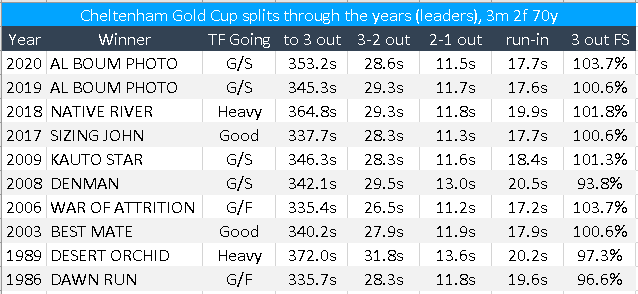
Denman’s win in 2008 was notable for a brutally strong pace and a slow-motion finish (see that finishing speed %, which is the speed from three-out expressed as a % of the speed for the race overall), that played to the strengths of such a thorough stayer.
Dawn Run’s and Desert Orchid’s wins were nearly as stamina-sapping within the context of the ground on which they took place, with the latter’s unforgettable success a triumph for sheer guts as much as anything.
By contrast, War of Attrition’s win was in a race that rewarded late speed, especially given the ground conditions, and so did this year’s Cheltenham Gold Cup, the second of Al Boum Photo’s victories.
The latter contest should be viewed through the prism of that fast finishing speed %, with runner-up Santini going on well at the death and sixth-placed Real Steel seeming not to get home at the trip even in these speed-favouring conditions (he had gone as short as 3.55 in running).
Al Boum Photo’s 2019 success had come in a time that was equivalent to around 40 lengths quicker, but with a 0.8s (four lengths) slower closing split, and proved his own stamina more categorically in a truly-run race.
The exercise of taking jumps sectionals can be tricky, as you need an accurate overall time – best taken from the leader passing the starter, and therefore not a given – and a knowledge of the distance from the sectional (the third-last obstacle is usually a good one) to the line.
Fences usually remain in situ, but hurdle distances need to be estimated on an ongoing basis by reference to nearby fixed features, including fences themselves. In both cases, Google Earth can be the indefatigable sectionalista’s friend!
The issue with hurdles moving around is why the Cheltenham Gold Cup was chosen above as a historical illustration and not the Champion Hurdle. But hurdles do not move within a card and so one-on-one comparisons may still be very revealing.
Here are a trio from this year’s Cheltenham Festival – with the sectionals for the winners themselves – followed by some commentary of what the figures signify.
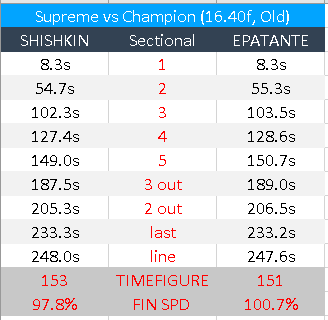
That Shishkin ran only 0.4s (two lengths) slower in winning the Supreme Novices’ Hurdle than Epatante did in winning the Champion Hurdle, while carrying 4 lb more, should raise a few eyebrows. As should those splits, which suggest the leaders in the novice race went a bit too quickly, resulting in some exaggerated margins behind.
Shishkin got to three out 1.5s (roughly seven and a half lengths) ahead of Epatante, and yet he himself was three and a half lengths behind the leader at that stage, Asterion Forlonge. Abacadabras went on between the last two – plenty early enough in the circumstances – but Shishkin was soon on his tail and finally got past near the line.
The comparison reflects well on the novices – not just the two who fought out the finish but those who paid for racing close up – more than it does on the Champion Hurdle principals.
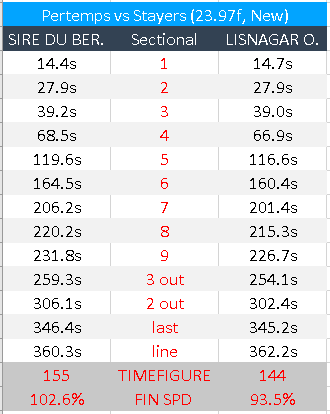
That the Pertemps was won in a time 1.9s (nearly 10 lengths) quicker than the Stayers’ Hurdle by a horse carrying 2 lb more tells you something. What it tells you, in conjunction with those splits and finishing speed figures, is that the Stayers’ form is substandard and that the runners did too much too soon in the race.
That 93.5% finishing speed for Lisnagar Oscar is remarkably slow. He lost around 15 lengths on Sire du Berlais up the run-in and yet was still able to extend his advantage slightly over rivals who were going up and down on the spot.
Sire du Berlais had to be a very smart performer to do what he did in a race that was close to well-run. It is not so clear that the same applies to Lisnagar Oscar or to those he beat.
The nightmare, for those of us who backed the horse, of Goshen’s last-flight departure in the Triumph Hurdle on the final day of the Cheltenham Festival in March was soon replaced by a nightmare of a far bigger and more global nature. But the scars of that first race on Friday 13th remain.
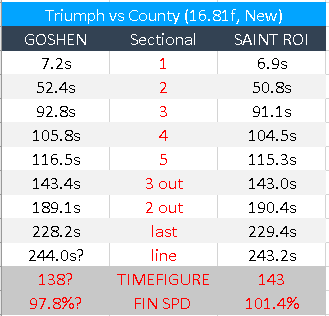
The problem when analysing the Triumph sectionals is that far and away the most interesting horse disappeared from the record. What I did was extrapolate the run-in sectional from those that preceded it and the run-in splits of those that completed, an exercise which suggests that Goshen would have won by about 3.4s, or around 15 lengths.
Impressive, for sure, but that would still have seen Goshen finishing much slower than Saint Roi managed in winning the County Hurdle a bit later, and would have resulted in a slower overall timefigure, too.
Goshen tore his field apart between three out and the last, a section in which he was about eight lengths quicker than Saint Roi, but Saint Roi’s finishing effort would very likely have been more impressive.
Goshen does not come out of the comparison especially well, but he comes out of it much better than those who stood up and ultimately fought out the finish of the Triumph.
Meanwhile, Saint Roi was fastest of all hurdle winners up the run-in on the New Course on the last two days of the 2020 Festival. It is not possible to rate his bare performance higher than in the mid-140s without over-rating those he beat, but that very likely undersells his merit.
Timeform now has Saint Roi on 150 with a “p”, while an average Champion Hurdle winner in the last five years has come in at 166.4 after adjustment for sex allowance.
.jpg&w=300)

.jpg&w=300)
.jpg&w=300)
.jpg&w=300)
.jpg&w=300)


