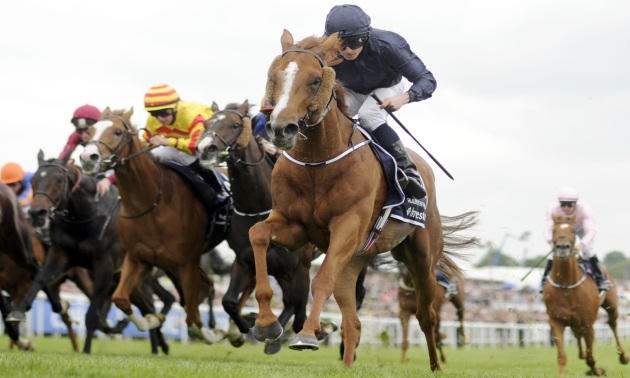
When the time comes for me to curl up my sectional toes, I have a number of places in mind for where my ashes should be scattered. One of them is on the path entering the home straight at Epsom, though not while racing is taking place if the executor of my will is to avoid a fate similar to that which befell Emily Davison in 1913.
In the days before widespread electronic sectional timing in the UK – the 13.8 billion years to now, and counting, in other words – that path, coming at a stage when the race is often about to develop, has taken on a near mystical significance as the best juncture at which to take manual sectionals in The Derby.
Sadly, I failed to record a closing sectional for the first Derby I witnessed (on television) – the 1974 affair won by Snow Knight, which entailed bunking off Junior School early – but I have done so for all but one of the subsequent ones, and a few of the earlier ones, either live or through recourse to YouTube.
This unhealthy obsession does have its uses. In addition to bragging rights among the Anorak fraternity, it has been possible to interpret the results of Derbys with greater accuracy.
Dynasties rise and fall, rails are moved in and out, but that path has stayed where it is for longer than any of us can remember. If a horse spends much more or much less than 26.2% of its overall race time in the section from that path to the line then it has used its energy inefficiently.
That 26.2% figure is equivalent to a finishing speed (expressed as a comparison to average race speed) of 113.4% if you take that closing sectional as 3.58f (Google Earth) and the overall race distance (remeasured prior to 1992) as 12f and 10 yards.
Higher finishing speed %s indicate steadier relative paces early; lower finishing speeds indicate the opposite. If you think that 113.4% is high, that’s because it is: it is the highest sectional par in Britain and results from both a downhill finish and a particularly severe half-mile at the start of the race.

Those past Derbys can look rather different in the light of sectionals. For instance, the mighty Shergar registered not only the slowest winning sectional but the slowest finishing speed % of a winner on record: testing conditions and a strong gallop (which he lay up with easily) meant his rivals were going nowhere long before the end. Nijinsky and Galileo vie for the fastest closing split: a testament to both fast conditions and a steady earlier pace (and to two good winners).
Hawk Wing suffered a triple whammy of softer going than usual, a better opponent (in High Chaparral) than usual and, crucially, a stronger pace than usual when running out of stamina late on in the 2002 Derby. Pour Moi came from further back (approx. 1.75s) in 2011 than any other winner on record, despite the pace being fair rather than stronger.
One Derby missing from the above table is probably the most contentious recent Derby of them all, the 1986 one, which has gone down in racing folklore as the race Dancing Brave lost more than as the race Shahrastani won. Sectionals shed light on that, too, as the following excerpt shows.

It was not that Greville Starkey, the jockey of Dancing Brave, got too far back per se – Pour Moi won from further behind, as we have seen – but that he got too far back in what had been a steadily-run race despite the large field.
Starkey was pushing along on Dancing Brave from before the sectional, and it was only late on that Dancing Brave made serious inroads into Shahrastani’s advantage. The latter had been always close up and struck for home over 2f out but was still running quicker than par late on, which made him more difficult to overtake.
Those sectional mark-ups suggest strongly that Dancing Brave “should” have won the 1986 Derby. As one wag in editorial just said to me “you don’t need sectionals to tell you that!” However, sectionals further suggest that Dancing Brave – who was beaten by half a length – could be rated the winner by about two and a half lengths. No late headway monkey, this, and I could see him winning a string of top-races, culminating in a remarkably strong Arc, before bombing out in America.
More often than not, sectionals confirm that the winner was indeed the best horse in The Derby. And they sometimes suggest that he was better than the result in winning, such as was the case with Camelot in 2012 and Pour Moi in 2011.
Epsom, the home of The Derby, is an idiosyncratic course as it is, and unsatisfactory results as a consequence of false paces are unfortunate in what is meant to be one of the supreme tests of a thoroughbred.
Here’s hoping that the 2014 edition is a true test, in which the best horse wins. But, if it isn’t, and the best horse seemingly doesn’t, then that crossing at the entrance to the home straight is likely to come under even more sectional scrutiny than usual.
***Postscript***
Improved image quality on Google Earth means that it is possible to ascertain the distance of that closing sectional with greater accuracy and confidence. It transpires that I had incorrectly identified the winning line, which is 3.44f from the sectional, and not 3.58f as previously imagined (what’s 30 yards in British racing, eh?!).
Embarrassing, but in reality it makes little difference to any of those calculations once they are properly adjusted. The par finishing speed % for a mile and a half at Epsom is around 111.0 as a consequence.
Incidentally, Australia ran a 39.65s sectional (110.6% finishing speed) in winning The Derby in 2014.


.jpg)


 Url copied to clipboard.

.jpg&w=300)
.jpg&w=300)

.jpg&w=300)

.jpg&w=300)


